TL;DR
The financial model structure—payback period, error-rate KPIs, sensitivity analysis—that turns an automation proposal into a CFO-approved project.
Automation ROI: How to Build the Business Case Your CFO Will Actually Approve
Your accounts payable team processes several hundred invoices every week. Each one requires a human to open an email, extract line items, match against a purchase order, flag discrepancies, and route for approval. The process works—until three people call in sick simultaneously, month-end closes late, and your CFO asks why the finance team logged thirty hours of overtime last quarter. That question is your opening.
Most automation proposals die not because the technology is wrong, but because the business case is built for an IT audience instead of a financial one. CFOs are not opposed to automation. They are opposed to vague projections, undisclosed implementation costs, and payback timelines measured in years rather than quarters. This article walks you through the financial model structure that closes the gap.
Start With the Cost Baseline, Not the Technology
Before you open a spreadsheet, document the current state in operational terms your CFO already cares about.
Identify every labor hour directly associated with the process you intend to automate. Include handling time, exception management, rework, and supervisory review. Then add indirect costs: error-driven rework, late payment penalties, compliance gaps, and employee turnover in roles defined primarily by repetitive manual work. Turnover costs are routinely underestimated—recruitment, onboarding, and productivity ramp typically run several months of the departing employee's salary.
This baseline becomes your denominator. Every projected benefit in the business case is measured against it.
The Three Numbers Your CFO Needs First
| Metric | What It Measures | Why It Matters to Finance |
|---|---|---|
| Fully loaded labor cost | Total cost per transaction including benefits, overhead | Establishes the true cost of the status quo |
| Error rate and rework cost | Percentage of transactions requiring correction × correction cost | Quantifies quality risk in dollar terms |
| Process cycle time | End-to-end time from trigger to completion | Links operational delay to working capital or revenue impact |
Do not present technology features until these three numbers are on the table.
Building the Financial Model
Payback Period
The payback period is the single metric most CFOs use to make a quick go/no-go decision. Calculate it as:
Total implementation cost ÷ Annual net benefit = Payback period in years
Total implementation cost should include software licensing, integration development, data migration, testing, change management, and a contingency buffer. Projects that omit change management and contingency almost always exceed budget, which retroactively damages the credibility of the original proposal.
Annual net benefit is the sum of labor savings (hours reallocated × fully loaded hourly rate), error-reduction savings, and any revenue-side improvements such as faster invoicing cycles or reduced churn from better customer-facing processes.
For most mid-market automation projects, a payback period under eighteen months is approvable. Under twelve months is compelling.
Sensitivity Analysis
Single-point estimates invite skepticism. A sensitivity analysis shows your CFO that you have stress-tested the model. Build three scenarios:
- Conservative: Automation achieves 60% of projected efficiency gains, implementation runs 20% over budget
- Base: Model assumptions hold
- Optimistic: Adoption is faster than projected, error rates drop further than modeled
If the project is financially sound only in the optimistic scenario, it is not ready for approval. If it returns a positive NPV even in the conservative scenario, you have a fundable proposal.
Net Present Value and IRR
For larger investments, include NPV and internal rate of return. Use your organization's standard discount rate. A project with a positive NPV at your cost of capital and an IRR above your hurdle rate removes the financial objection almost entirely. These calculations also help you size the investment correctly—if the NPV is strongly positive, underinvesting in implementation quality is the real risk.
How a Technology Partner Should Approach This Problem
A capable technology partner does not arrive with a platform demo and a generic ROI calculator. The engagement should begin with a process diagnostic that independently validates your cost baseline. This matters because internal estimates are often either inflated by frustrated employees or deflated by managers protecting headcount.
The partner should then map the automation scope with explicit boundaries: what will be automated, what will remain human-in-the-loop, and what exception-handling logic is required. Automation scope creep—quietly expanding what the system is expected to handle without adjusting the cost model—is one of the most common reasons projects miss their financial targets.
Expect your partner to produce a phased implementation roadmap with discrete value milestones. Phase one should deliver measurable savings within ninety days. If a partner cannot identify a first-phase deliverable that produces a financial signal that quickly, treat that as a scoping problem, not a technology constraint.
Finally, the partner should commit to specific KPIs at project kickoff. Vague language about "efficiency improvements" is not acceptable in a business case and should not be acceptable in a vendor contract.
What to Measure in the First 90 Days
Early measurement serves two purposes: it validates the financial model and it builds internal confidence for broader rollout. Track these KPIs from day one of go-live.
- Transaction throughput rate: Volume processed per labor hour, compared directly to the pre-automation baseline
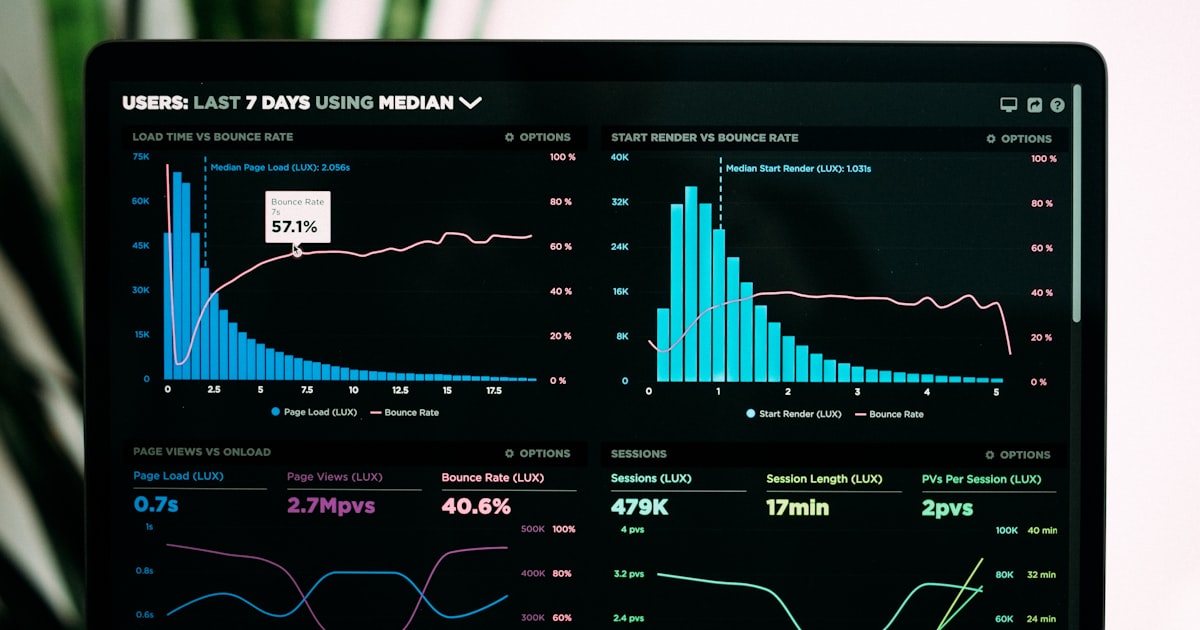
- Straight-through processing rate: Percentage of transactions completed without human intervention—your primary indicator of automation effectiveness
- Error rate post-automation: Errors per thousand transactions, compared to the baseline error rate used in the financial model
- Exception handling time: How long human review takes for flagged items—if this is rising, the exception logic needs tuning
- Cycle time reduction: End-to-end process time versus baseline, reported weekly
- Realized labor reallocation: Actual hours freed and how those hours are being deployed—this is what makes the savings real to your CFO
Review these metrics at thirty, sixty, and ninety days. If the straight-through processing rate is below projection at thirty days, investigate immediately rather than waiting for the ninety-day review.
Common Implementation Mistakes and How to Avoid Them
Underestimating Change Management
Automation changes how people work. Without structured communication, training, and a clear narrative about role evolution, adoption stalls and the projected labor savings do not materialize. Mitigation: Allocate a dedicated change management budget—typically ten to fifteen percent of total implementation cost—and assign an internal owner, not just a vendor resource.
Building the Business Case Around Headcount Reduction
CFOs approve this logic, but it creates organizational resistance that undermines adoption. Mitigation: Frame labor benefit as reallocation to higher-value work. This is both more accurate and more sustainable. Actual headcount decisions are a separate management conversation.
Automating a Broken Process
Automating a flawed process accelerates the flaws. Mitigation: Conduct a lightweight process improvement pass before implementation. Even minor standardization in the pre-automation state meaningfully improves straight-through processing rates.
Accepting a Big-Bang Go-Live
Single large deployments concentrate risk and delay the first financial signal. Mitigation: Insist on a phased rollout, even if the vendor prefers otherwise. A ninety-day pilot on a defined transaction subset is almost always feasible.
Locking In Metrics After Go-Live
Starting to measure only after launch means you have no credible baseline. Mitigation: Instrument the current process for at least thirty days before go-live. Baseline data is the foundation of your CFO's confidence in reported results.
Turning Approval Into a Repeatable Playbook
The business case that gets your first automation project funded is not a one-time document. It is a template. Once your ninety-day KPIs validate the model, you have a proof point that makes every subsequent proposal faster to build and easier to approve. Your CFO moves from skeptic to sponsor, and automation becomes a recognized capital allocation category rather than a series of individual requests.
The companies that scale automation fastest are not necessarily the ones with the most sophisticated technology. They are the ones that learned how to speak the language of financial accountability from the beginning.
Talk to Valego: info@valegos.com